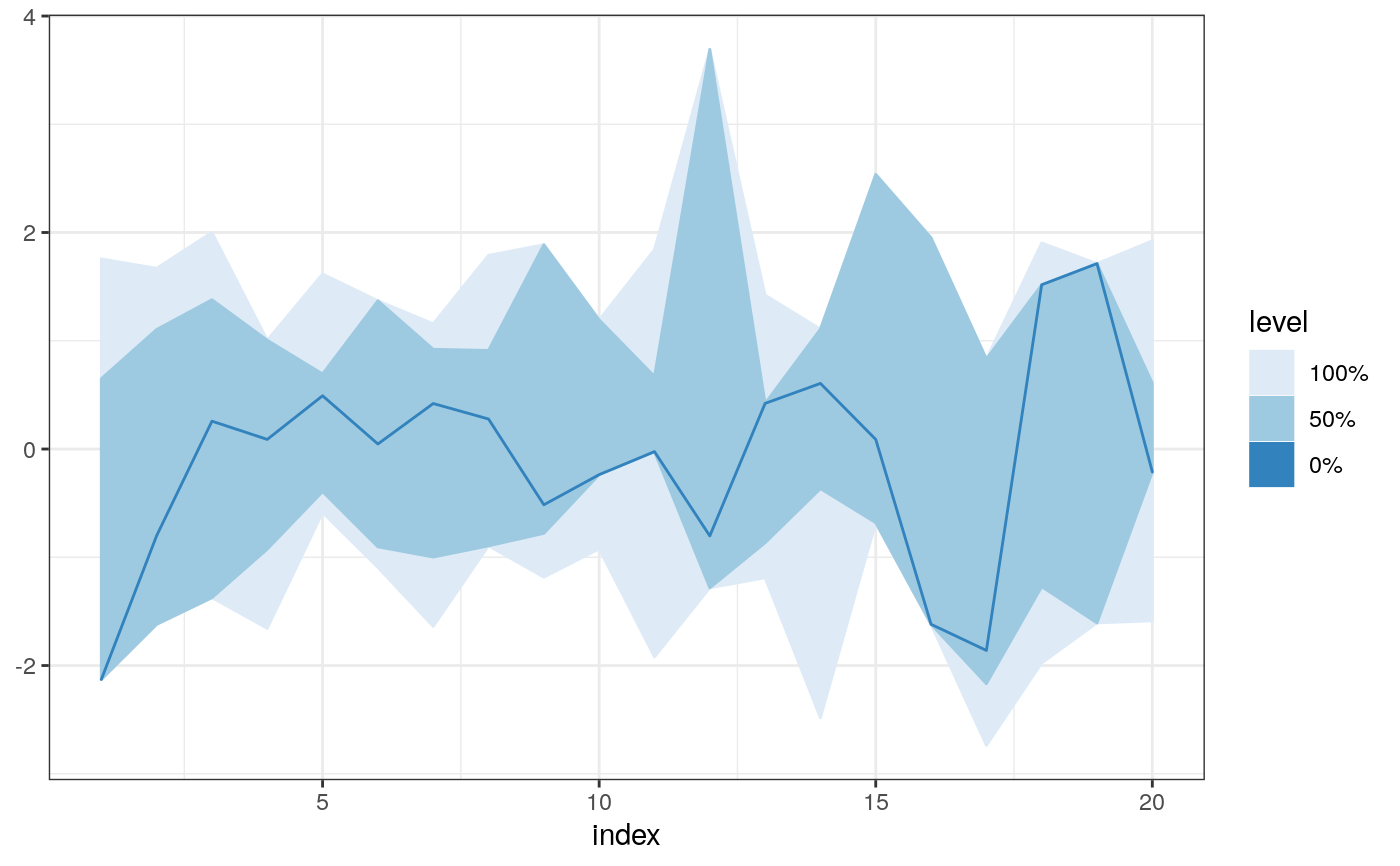
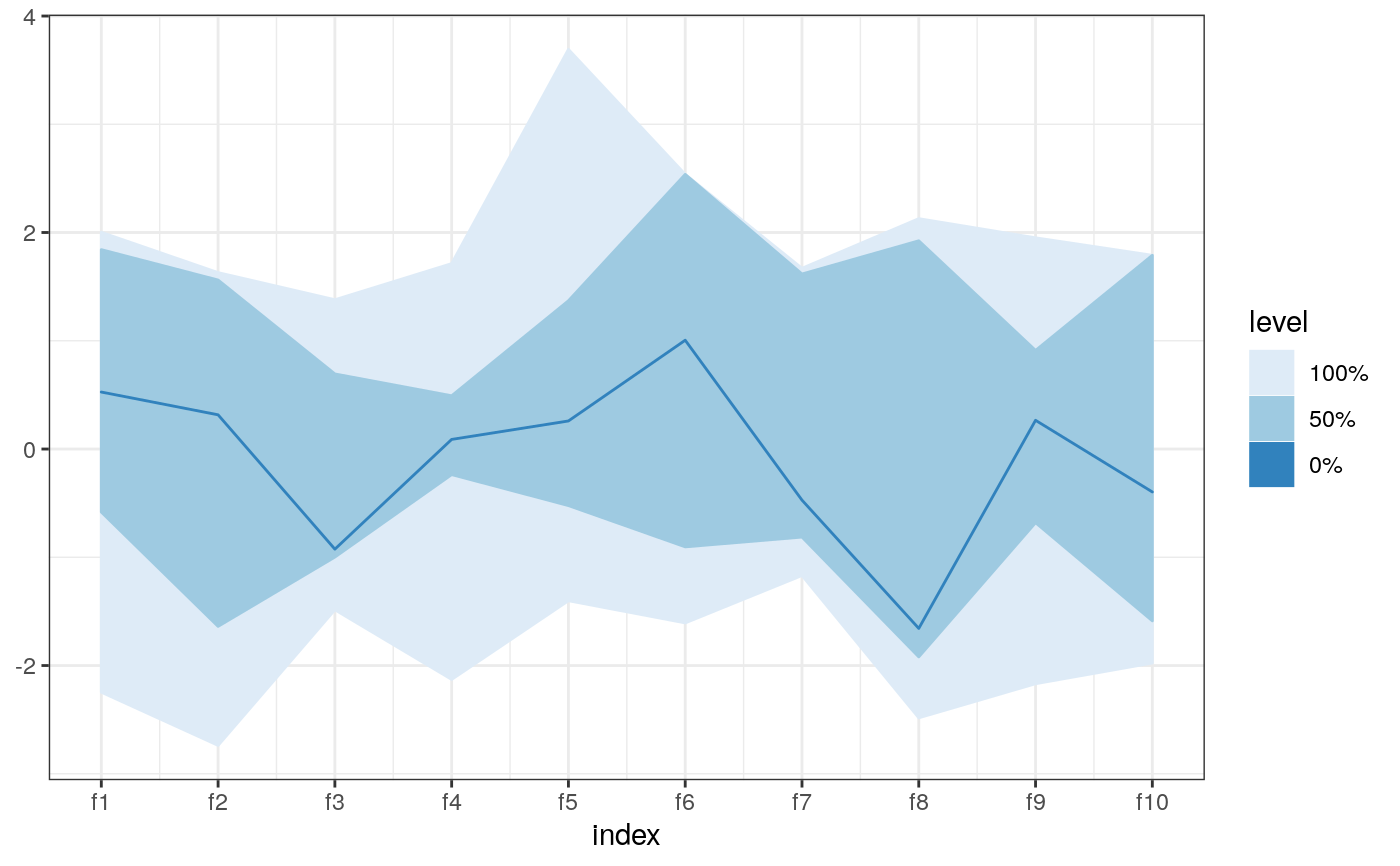
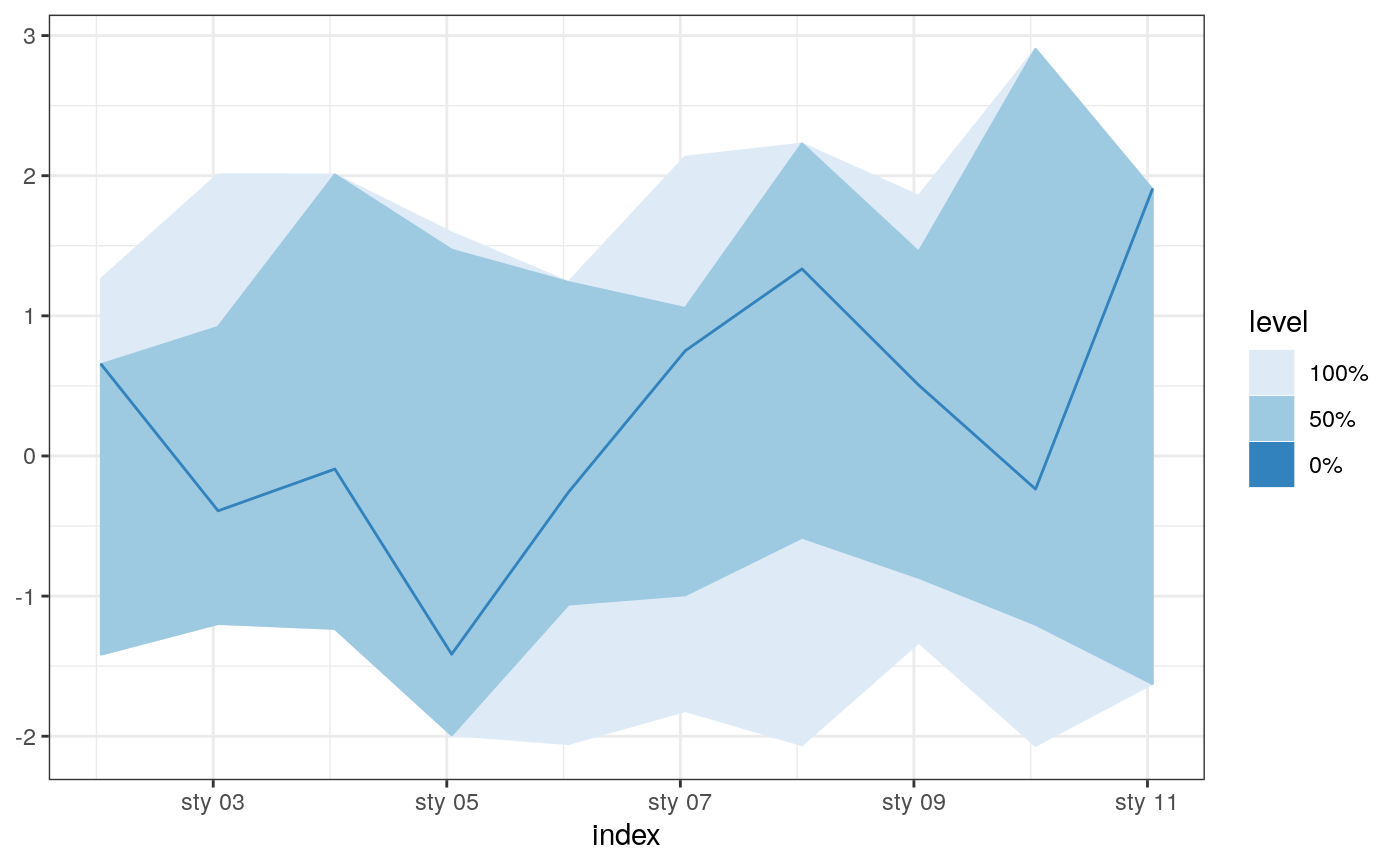
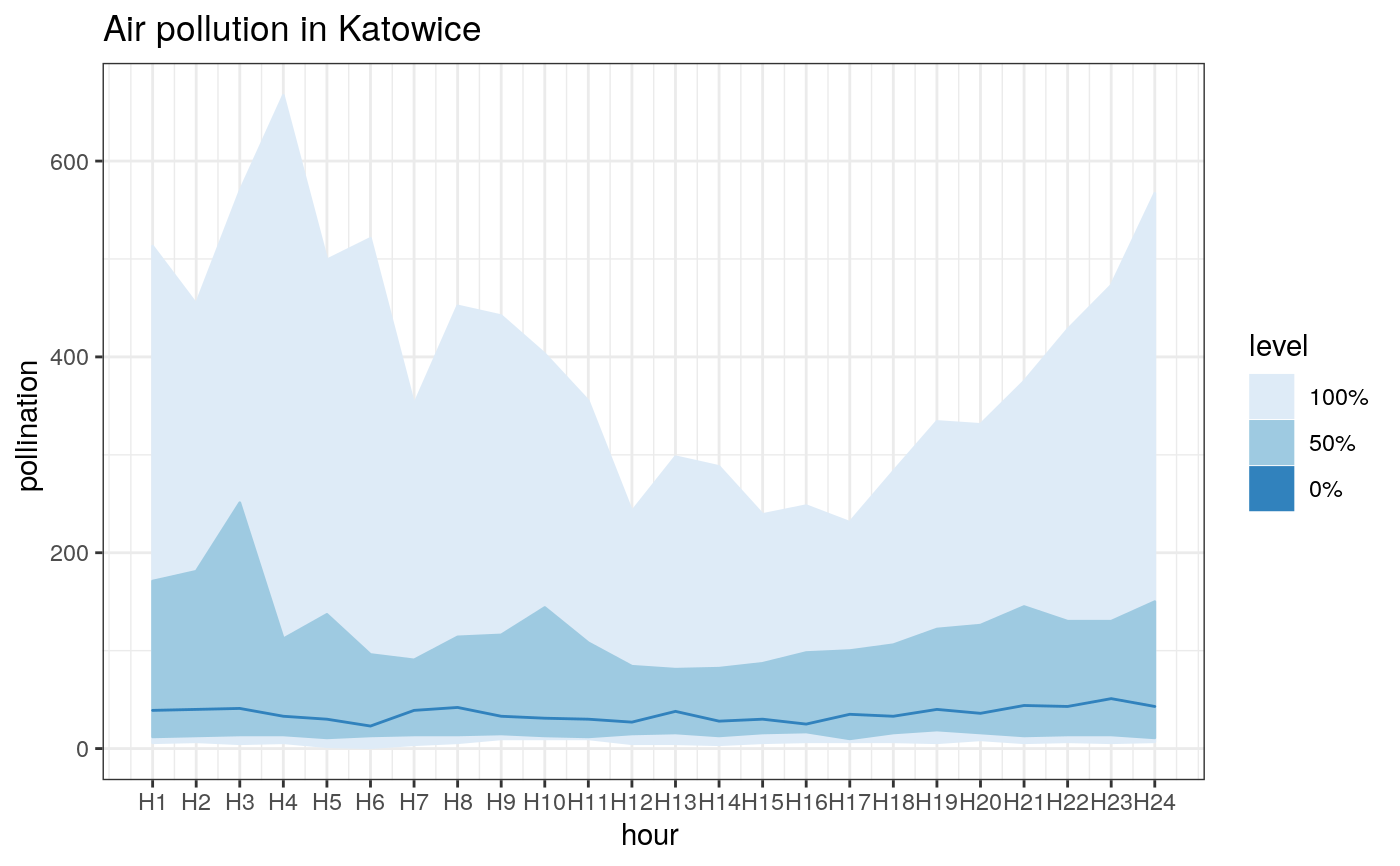
Functional boxplot based on Modified Band Depth
fncBoxPlot(u, X = NULL, bands = c(0, 0.5), method = "MBD", byrow = NULL, ...)
Arguments
| u | data matrix |
|---|---|
| X | reference set. If null u will be used as reference. |
| bands | limits for bands |
| method | depth method |
| byrow | byrow |
| ... | other arguments passed to fncDepth |
Examples
#>#> #>#> #> #>#> #> #>x <- matrix(rnorm(200), ncol = 10) time <- as.POSIXct(1:ncol(x) * 86400, origin = "1970-01-01") x_xts <- xts(t(x), order.by = time) fncBoxPlot(x_xts, bands = c(0, 0.5, 1), method = "FM")data("katowice.airpollution") pl <- fncBoxPlot(katowice.airpollution, bands = c(0, 0.5, 1), method = "MBD") pl + ggtitle("Air pollution in Katowice") + labs(y= "pollination ", x = "hour ")