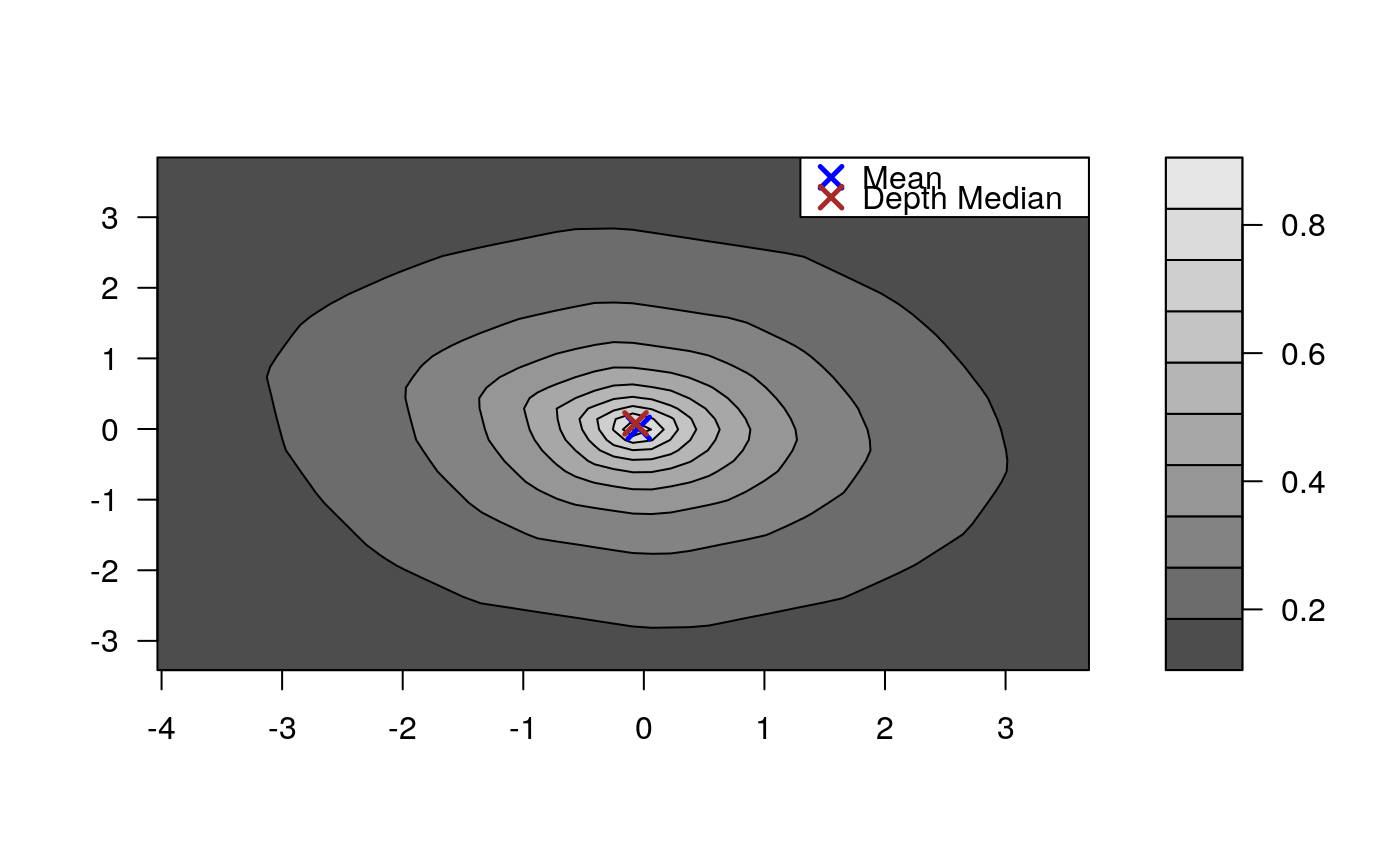
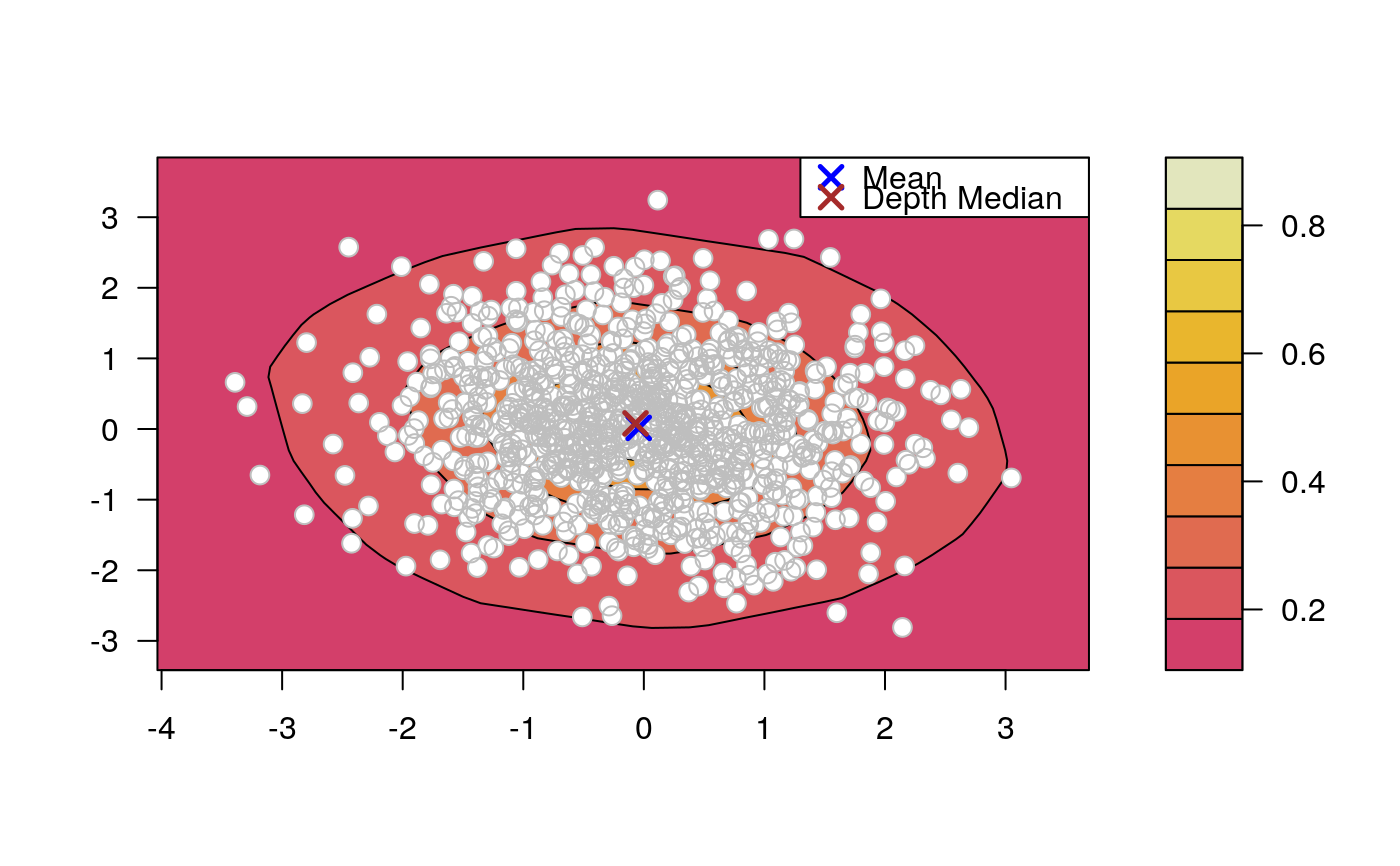
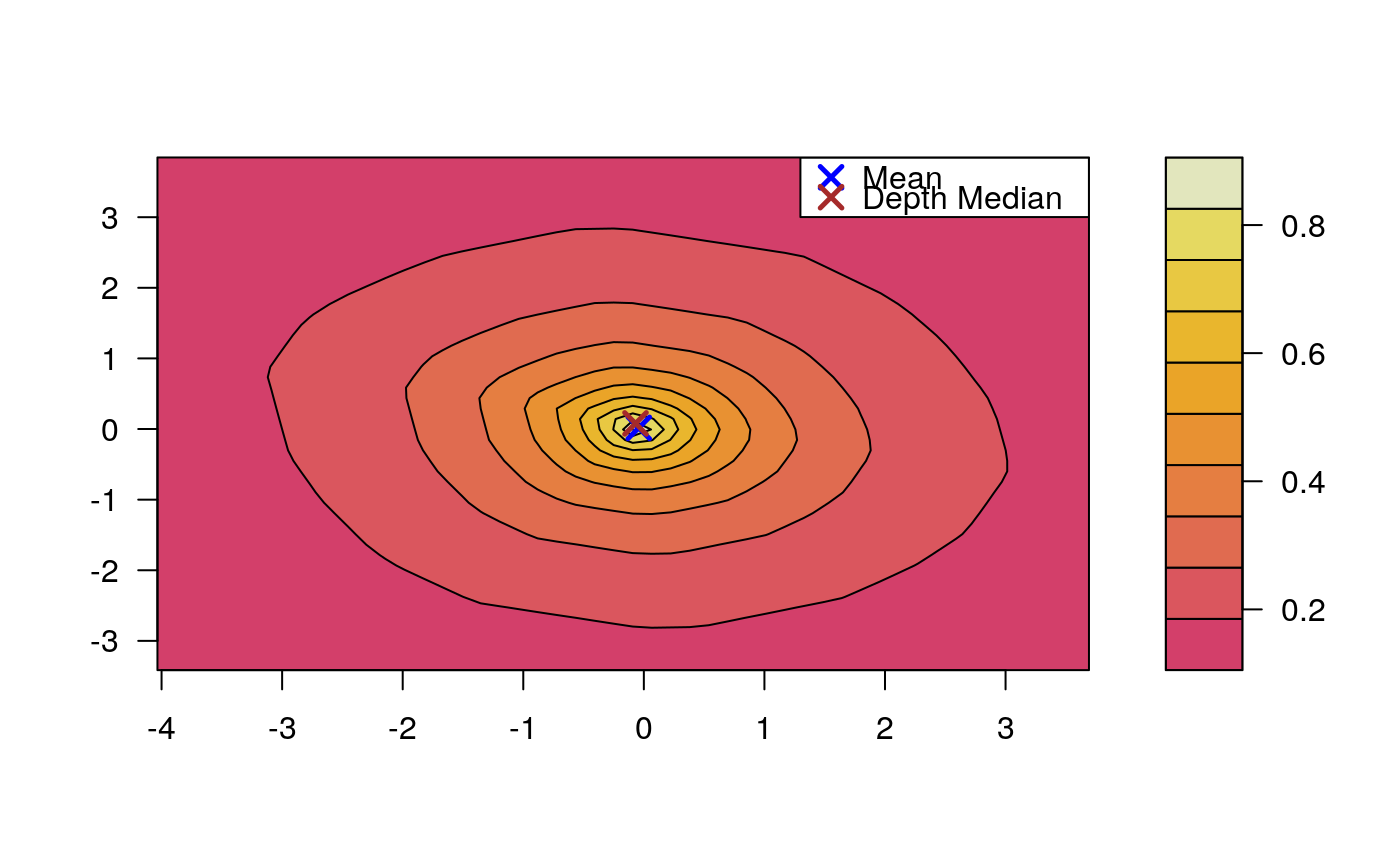
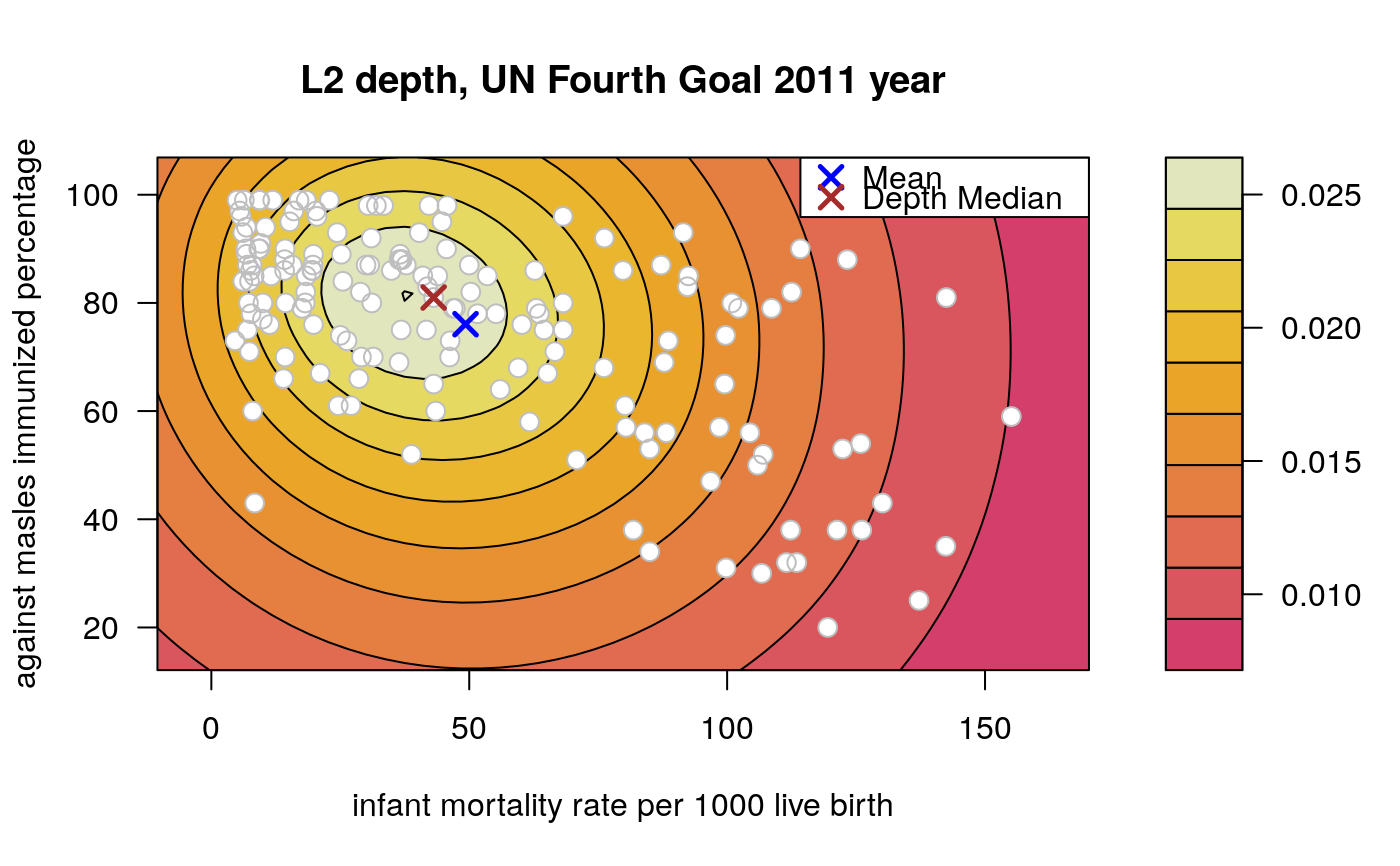
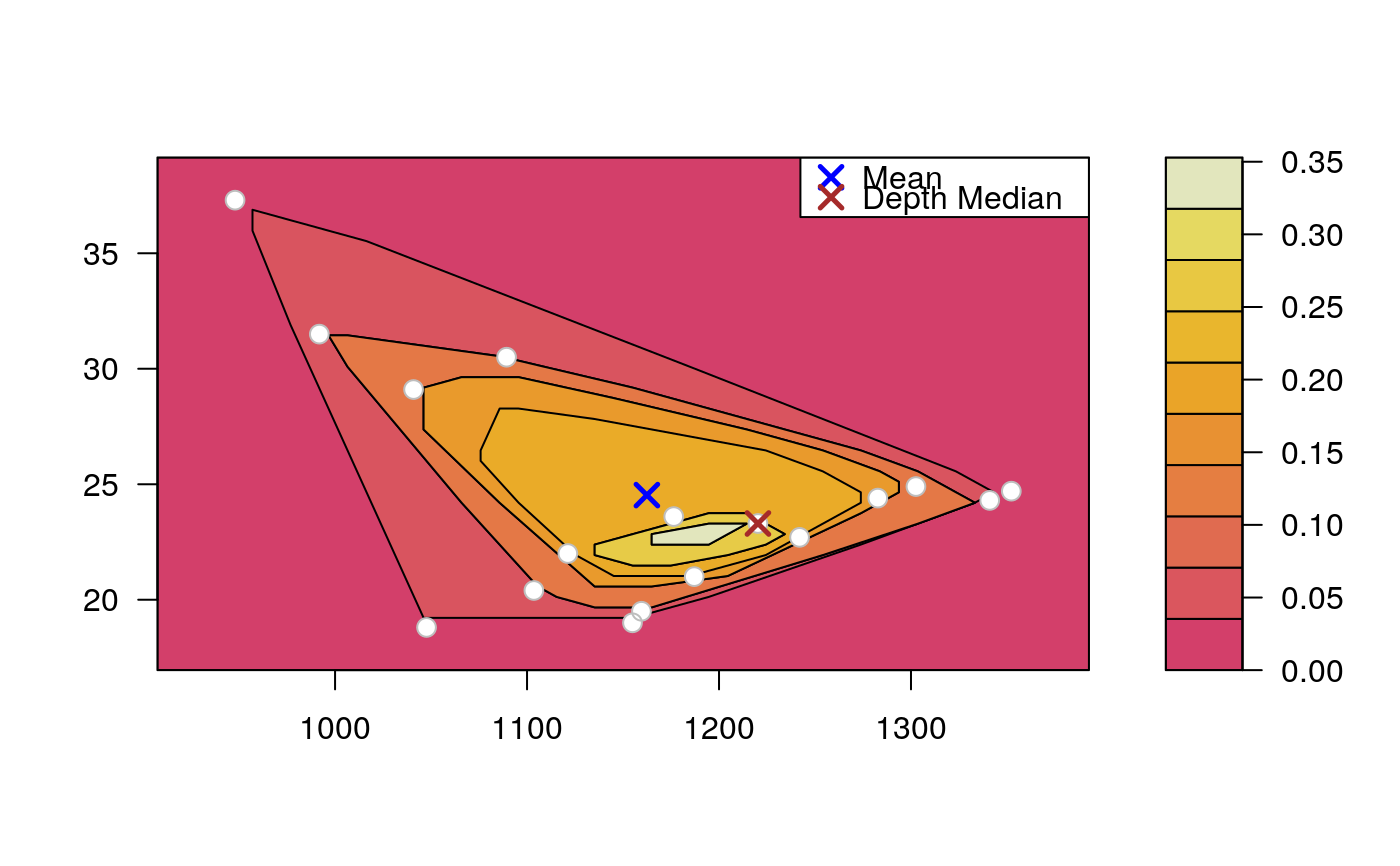
Draws an approximate contours of depth for bivariate data.
depthContour(
  x,
  xlim = extendrange(x[, 1], f = 0.1),
  ylim = extendrange(x[, 2], f = 0.1),
  n = 50,
  pmean = TRUE,
  mcol = "blue",
  pdmedian = TRUE,
  mecol = "brown",
  legend = TRUE,
  points = FALSE,
  colors = heat_hcl,
  levels = 10,
  depth_params = list(),
  graph_params = list(),
  contour_method = c("auto", "convexhull", "contour")
)
Arguments
| x | Bivariate data |
|---|---|
| xlim | Determines the width of x-axis. |
| ylim | Determines the width of y-axis. |
| n | Number of points in each coordinate direction to be used in contour plot. |
| pmean | Logical. If TRUE mean will be marked. |
| mcol | Determines the color of lines describing the mean. |
| pdmedian | Logical. If TRUE depth median will be marked. |
| mecol | Determines the color of lines describing the depth median. |
| legend | Logical. If TRUE legend for mean and depth median will be drawn. |
| points | Logical. If TRUE points from matrix x will be drawn. |
| colors | function for colors pallete (e.g. gray.colors). |
| levels | number of levels for color scale. |
| depth_params | list of parameters for function depth (method, threads, ndir, la, lb, pdim, mean, cov, exact). |
| graph_params | list of graphical parameters for functions filled.contour and contour (e.g. lwd, lty, main). |
| contour_method | determines the method used to draw the contour lines. The default value ("auto") tries
to determine the best method for given depth function.
"convexhull" uses a convex hull algorithm to determine boundaries.
"contour" uses the algorithm from |
Details
The set of all points that have depth at least \( \alpha \) is called \( \alpha \)-trimmed region. The \( \alpha \)-trimmed region w.r.t. \( F \) is denoted by \( {D}_{\alpha}(F) \), i.e., $$ {D}_{\alpha}(F) = \left\{ z \in {{{R}} ^ {d}}:D(z, F) \ge \alpha\right\}. $$
See also
Examples
# EXAMPLE 1 set.seed(123) x <- mvrnorm(1000, c(0, 0), diag(2)) depthContour(x, colors = gray.colors)# with points depthContour(x, points = TRUE)depthContour(x, points = FALSE, levels = 10)# EXAMPLE 2 data(inf.mort, maesles.imm) data1990 <- na.omit(cbind(inf.mort[, 1], maesles.imm[, 1])) depthContour(data1990, n = 50, pmean = TRUE, mcol = "blue", pdmedian = TRUE, mecol = "brown", legend = TRUE, points = TRUE, depth_params = list(method = "LP"), graph_params = list( xlab = "infant mortality rate per 1000 live birth", ylab = "against masles immunized percentage", main = "L2 depth, UN Fourth Goal 2011 year"))#EXAMPLE 3 data("france") depthContour(france, depth_params = list(method = "Tukey"), points = TRUE )
